What is cesr?
It is a collection of tools designed to be used with the statistics package R. cesr provides tools to perform basic analyses of annual variation in abundance, survival and productivity which are suitable for simple monitoring purposes. R has a number of advantages for statistical analysis: it is easy to introduce new analyses to it; it has good options for summarising and plotting data; and best of all, it is free.
How do I install it?
To use cesr you first need to download and install R (if it is not already installed on your computer). To do this you need to go to R homepage and click on the ‘download R’ link for your system. There are many guides to using R, some are easy to understand, others are highly technical and less easy to understand. Good places to start are the introductory guide available on the R website, which gives a few basic commands, and the quick-R website. You might also consider installing the RStudio software which provides a much nicer environment for writing and developing R code.
The basic R program allows you to do many things, but not everything. The beauty of the R system is that people can contribute ‘packages’ (cesr is one) that add specific extra functionality to the base system. The cesr package is now available for download and you can install it with the following R commands:
You should be able to copy and paste these commands into the R window; but if you type type them, note the dot, the colons, and the quotes, they are all necessary, and everything is in lower case. Some text will whizz by, all being well it will finish with something like "* DONE (cesr)". If you are not using the very latest version of R, it may finish with "Error: Failed to install 'cesr' from GitHub", if so and there is a message about the data,table package being built under a newer version then try typing (or copy-pasting):
R_REMOTES_NO_ERRORS_FROM_WARNINGS="true"Before retrying the second line above again (omitting the ", build_vignettes=TRUE" sometimes also helps if you are getting a different error).
How do I use it?
To start using the package type into the R window
library(cesr)
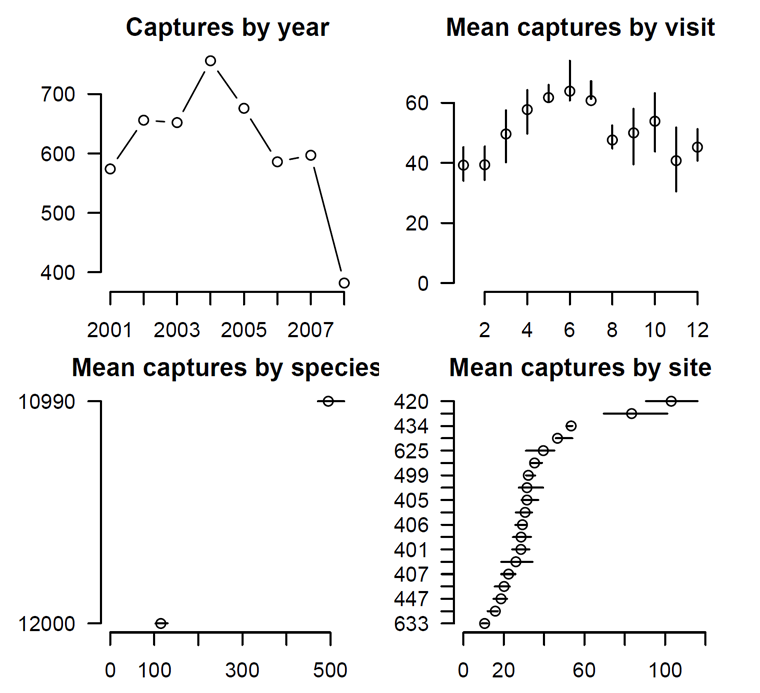
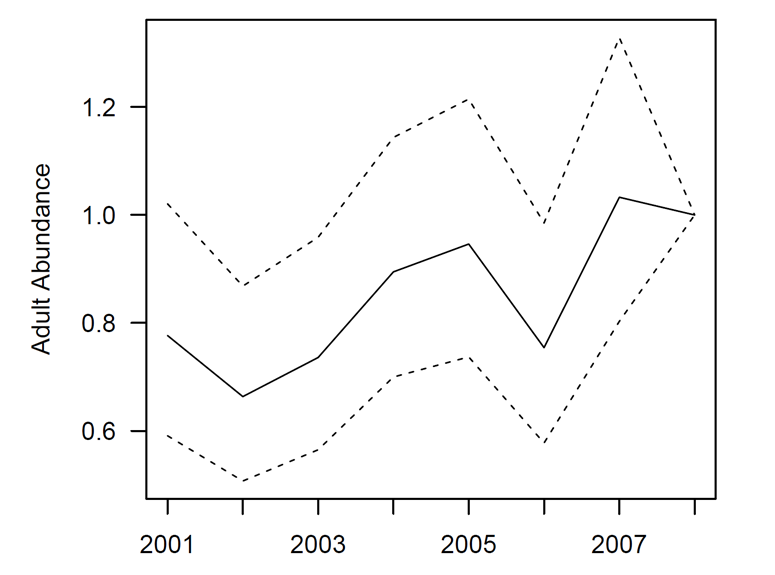
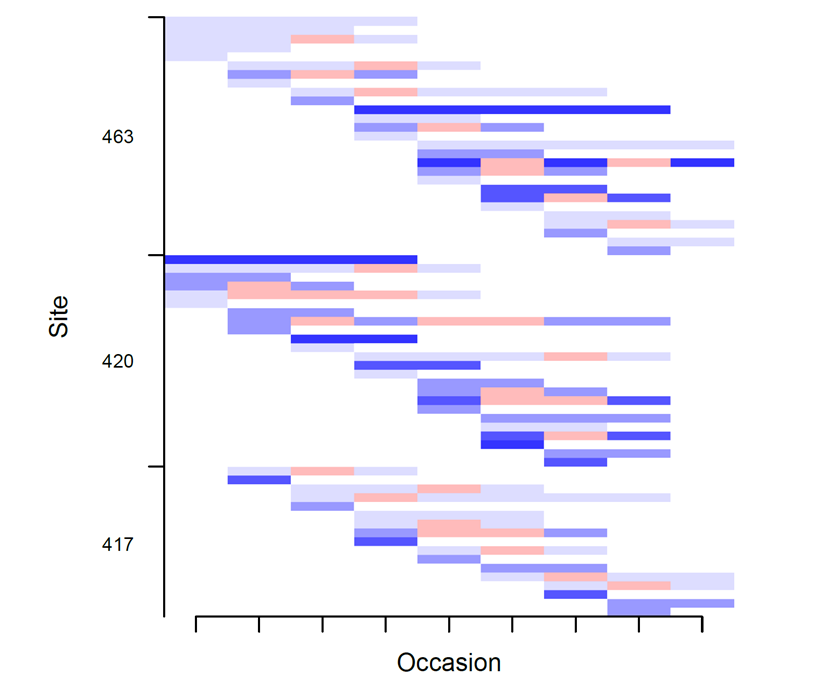
vignette("cesr-intro")What can it do?
The package reads in data in the agreed EuroCES format, provides tools for plotting and summarising the data, and for producing indices of annual abundance, productivity and survival. These are some plots produced by the package: